cpt extracts a named colour palette from the internal cpt-city
database and returns either a character vector of n interpolated
hex colours or the underlying colorRampPalette
function itself. The package ships 7140 colour gradients from
https://phillips.shef.ac.uk/pub/cpt-city/.
cpt(
  pal = "mpl_inferno",
  n = 100,
  colorRampPalette = FALSE,
  rev = FALSE,
  frgb = rep(1, 3)
)
Arguments
- pal
Character. Name or position of the colour gradient in the cpt-city archive. Default
"mpl_inferno".- n
Integer. Number of colours to return when
colorRampPalette = FALSE. Ignored whencolorRampPalette = TRUE.- colorRampPalette
Logical. If
FALSE(default), returns a character vector ofnhex colours. IfTRUE, returns acolorRampPalette*function* – this is what you need forplot(pal =) andscale_fill_gradientn(colours =).- rev
Logical. If
TRUE, reverses the order of colours before interpolation.- frgb
Numeric vector of length 3. Per-channel scaling factors for
c(red, green, blue). Values > 1 boost the channel, < 1 reduce it. Defaultc(1, 1, 1)(no scaling).
Value
A character vector of hex colours (length n) when
colorRampPalette = FALSE, or a colorRampPalette function
when colorRampPalette = TRUE.
Details
**`sf` / `ggplot2` users:** use colorRampPalette = TRUE.
The sf plot method and ggplot2's
scale_*_gradientn need a *function*, not a character vector.
See the examples below.
Examples
library(cptcity)
# Character vector -- use with base graphics
image(matrix(1:100), col = cpt(pal = "mpl_inferno"))
 image(matrix(1:100), col = cpt("idv_temperature", rev = TRUE))
 # colorRampPalette function -- use with sf and ggplot2
if (FALSE) { # \dontrun{
library(sf)
nc <- st_read(system.file("shape/nc.shp", package = "sf"))
plot(nc["AREA"], pal = cpt("mpl_inferno", colorRampPalette = TRUE))
library(ggplot2)
ggplot(faithfuld, aes(waiting, eruptions)) +
geom_raster(aes(fill = density)) +
scale_fill_gradientn(colours = cpt(n = 100, pal = "mpl_inferno"))
} # }
# Search for palettes by keyword
find_cpt("temperature")
#> [1] "arendal_temperature" "idv_temperature" "jjg_misc_temperature"
#> [4] "kst_03_red_temperature"
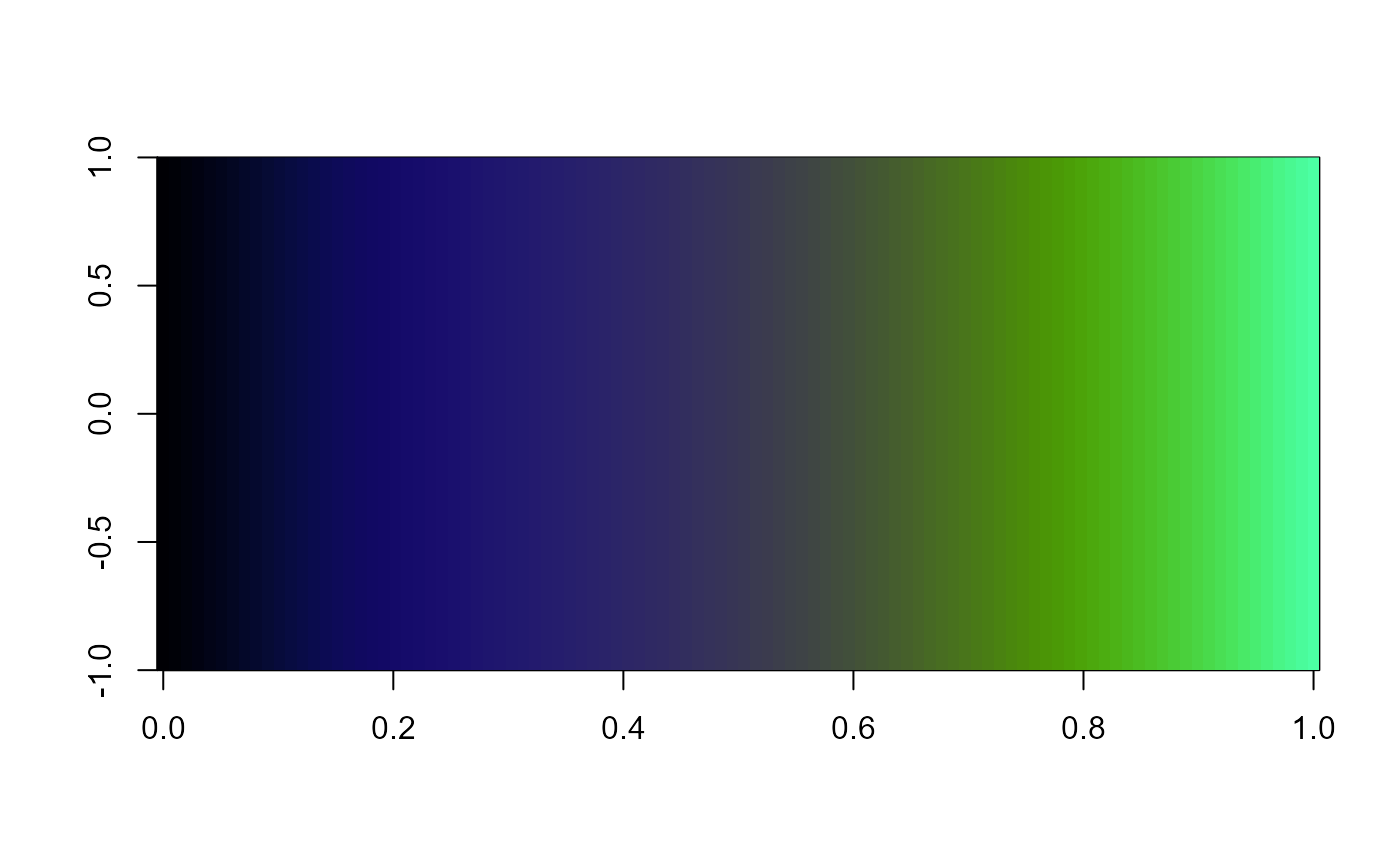
image(matrix(1:100), col = cpt("idv_temperature"))
# colorRampPalette function -- use with sf and ggplot2
if (FALSE) { # \dontrun{
library(sf)
nc <- st_read(system.file("shape/nc.shp", package = "sf"))
plot(nc["AREA"], pal = cpt("mpl_inferno", colorRampPalette = TRUE))
library(ggplot2)
ggplot(faithfuld, aes(waiting, eruptions)) +
geom_raster(aes(fill = density)) +
scale_fill_gradientn(colours = cpt(n = 100, pal = "mpl_inferno"))
} # }
# Search for palettes by keyword
find_cpt("temperature")
#> [1] "arendal_temperature" "idv_temperature" "jjg_misc_temperature"
#> [4] "kst_03_red_temperature"
image(matrix(1:100), col = cpt("idv_temperature"))
 # Tint the palette by scaling the red channel down
image(matrix(1:100), col = cpt("mpl_inferno", frgb = c(0.3, 1, 1)))
# Tint the palette by scaling the red channel down
image(matrix(1:100), col = cpt("mpl_inferno", frgb = c(0.3, 1, 1)))