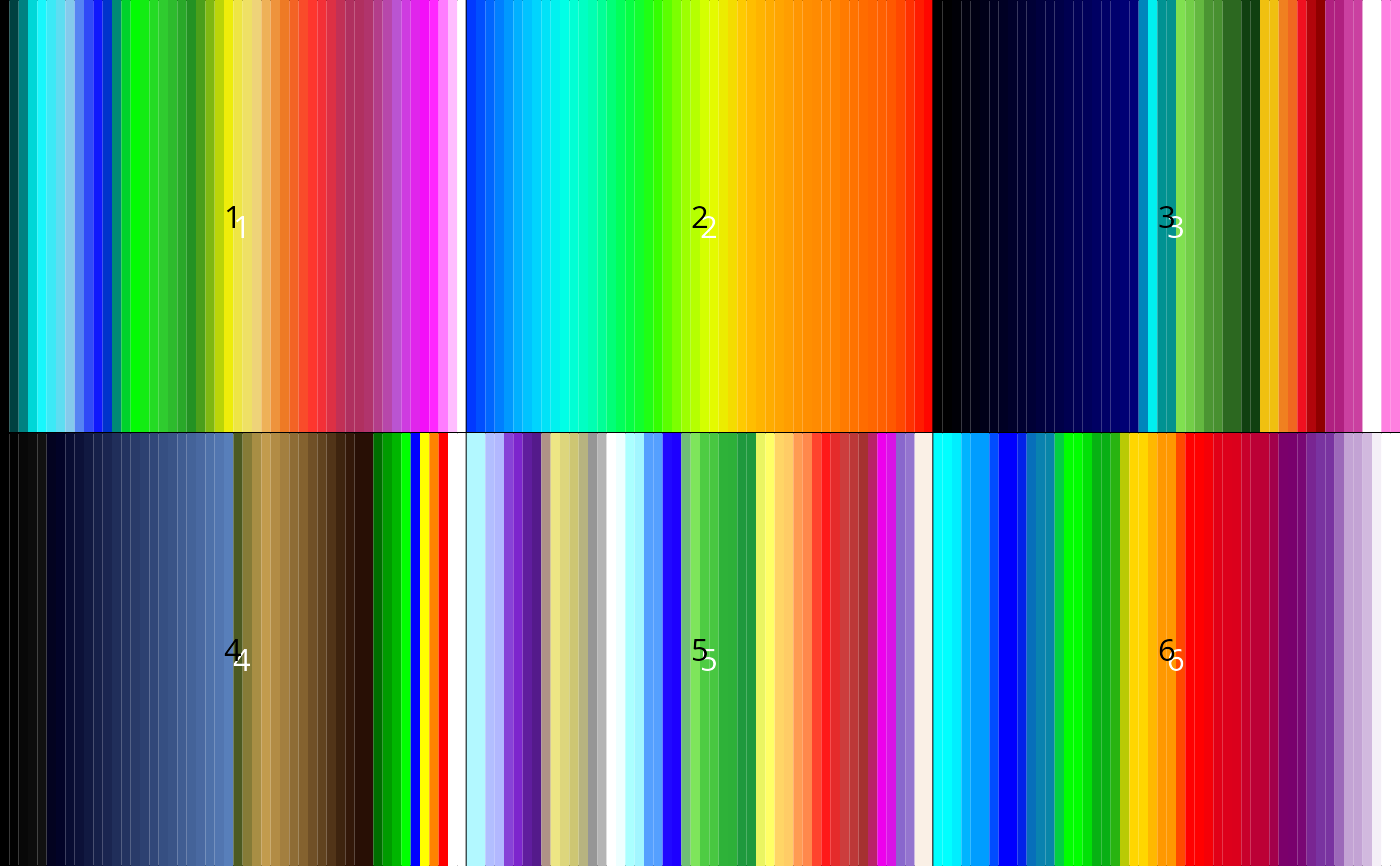
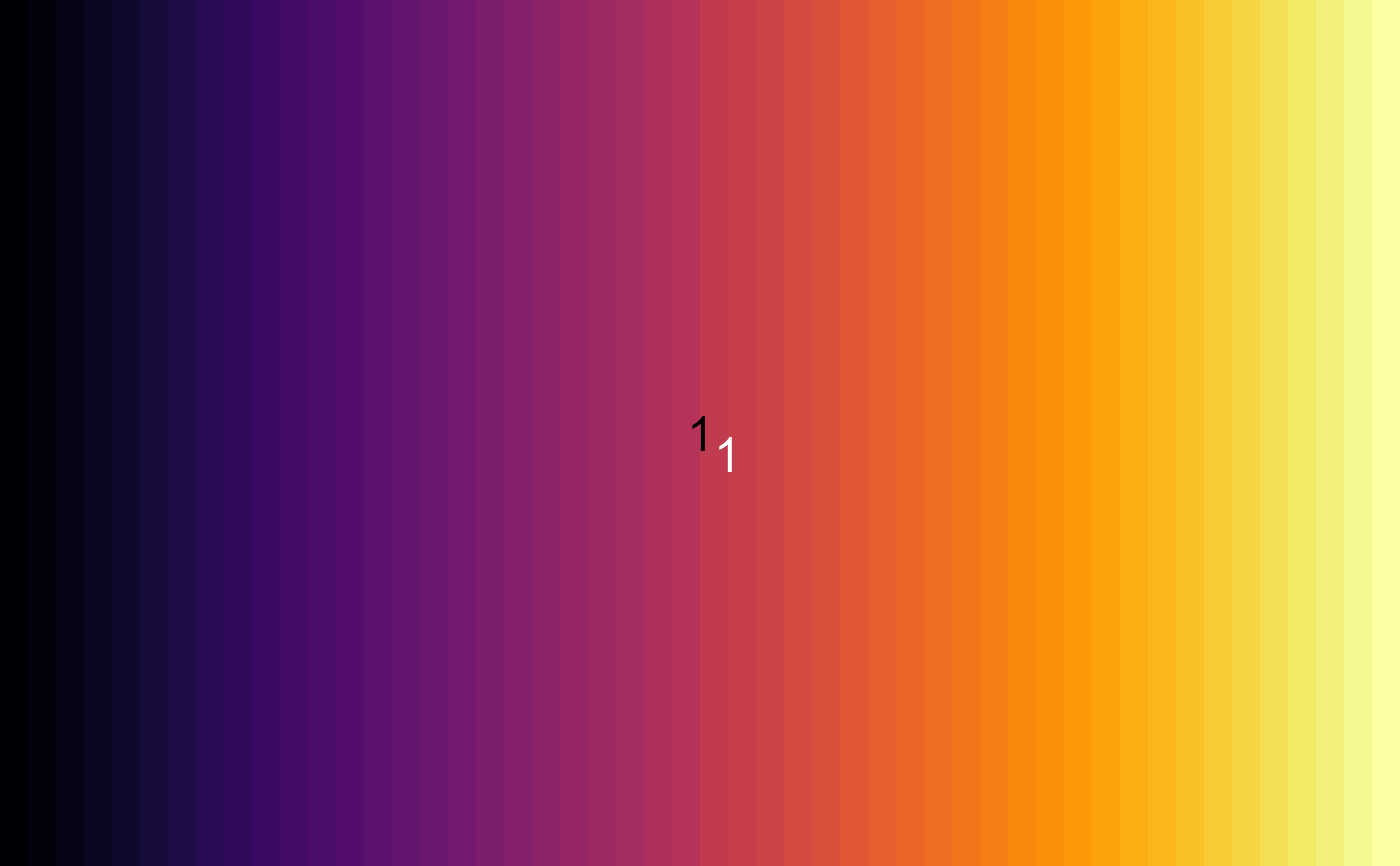
Draws each palette as a horizontal colour bar using
image, arranged in a grid that
automatically adapts to the number of palettes.
show_cpt(x, label = TRUE)Arguments
- x
Character vector. Palette names (e.g. output from
find_cpt).- label
Logical. If
TRUE(default), overlay a numbered label on each colour bar.
Value
Called for its side effect (a plot). Invisibly returns the palette names.